
March 2025 vs November 2024 – similar revenues, but a completely different distribution!

FlexPlum Team
•
April 22, 2025
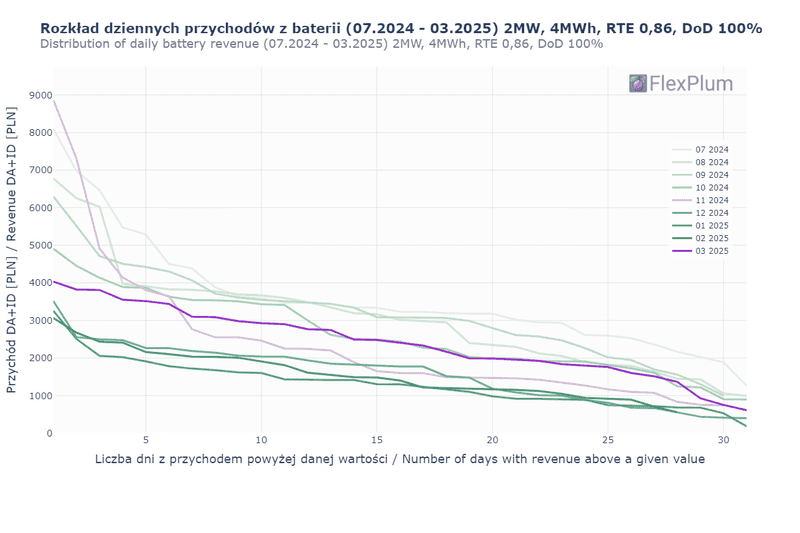
In our last post, we noted that the monthly DA+ID revenue of our model battery (2 MW, 4 MWh, RTE 0.86, DoD 100%) in March was similar to that in November. But the way it was distributed over the month was completely different – and much more favorable for the investor.
The chart below shows how many days in the month the battery earned more on DA+ID than the value marked on the vertical axis.
🔹 November – heather color
🔹 March – purple color
In November, a few days were highly profitable (Dunkelflaute), but the rest of the month was weak. Range: 0.8–8.8k PLN/day. In March, revenues were more stable: 0.8–4k PLN/day.
🔍 What does this mean?
It’s very good news for investors – even if the battery was temporarily unavailable, the loss of potential earnings on the best days in March would have been far less painful than on the best days in November.
Tell us what you think!
What do you notice? Is the chart clear to you? Let us know in the comments!
We warmly invite you to visit our LinkedIn profile and share your thoughts in the comments under our latest post:
March 2025 vs November 2024 – similar revenues, but a completely different distribution!
#EnergyStorage #BatteryStorage #FlexPlum #BESS #Poland #Optimization #Revenue #EnergyMarket #MagazynEnergii #Magazyn Energii #Optymalizacja magazynu energii #Przychody z magazynu energii #OptymalizacjaMagazynuEnergii #PrzychodyZMagazynuEnergii #Dofinansowanie nfosigw #NFOŚiGW
© 2025 FlexPlum. All rights reserved.